Weekly Assignment 14
INFO 3402, Spring 2021
Early in this semester I made an argument as to why WandaVision was the best show airing at the time.
To do this, I created a visualization using a dataset from this source I then made an html page to host the data visual that I created as a static image.
Here's what it looked like:
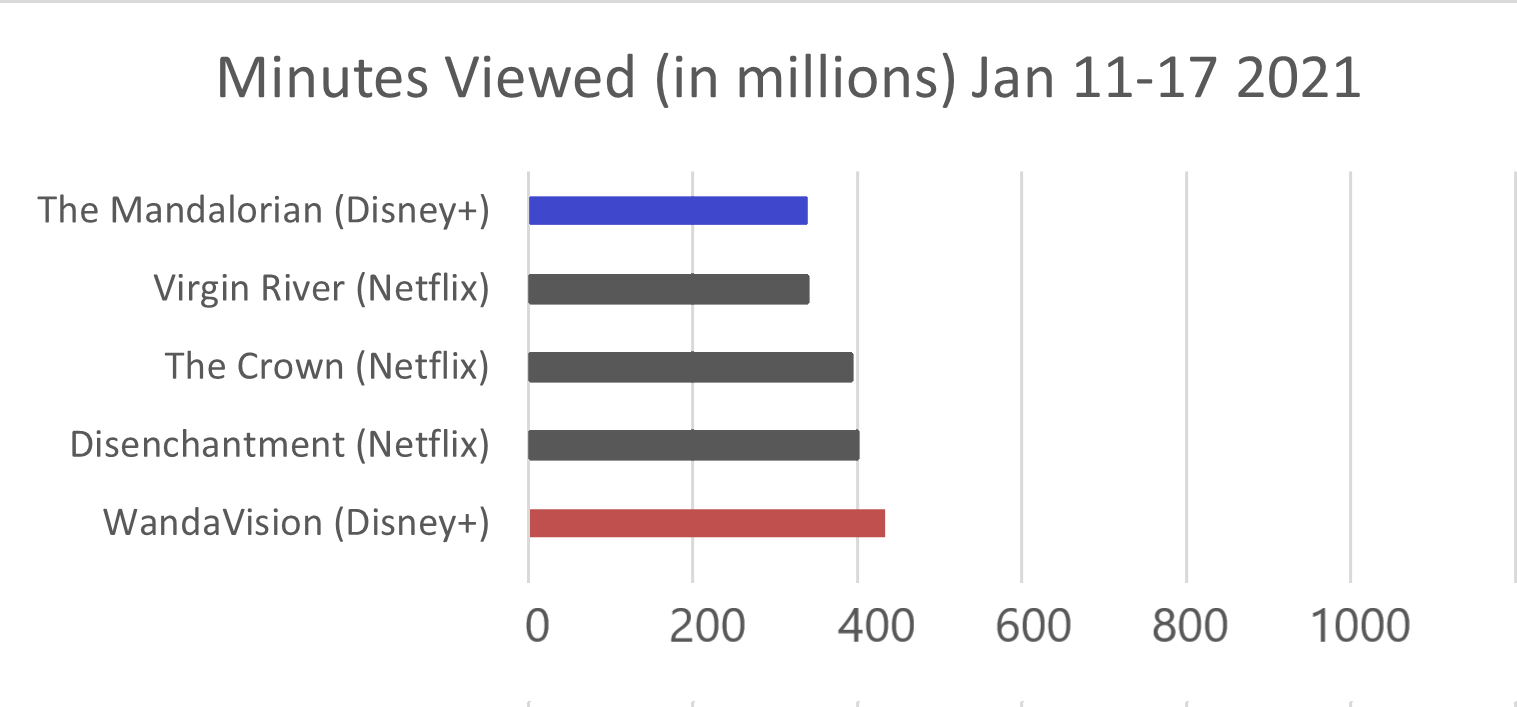
This was efficient at the time, but there are even better ways to aggregate and display data to tell a story.
Another way to present this data, perhaps to another audience would be...
With a Vega Visualization!
A third way to make this point with data...
is with Reveal.JS!
Reveal.JS
Reveal.js creates the presentation layout seen before you, and makes storytelling through data much easier.
			section>
			link rel="stylesheet" href="https://cdnjs.cloudflare.com/ajax/libs/reveal.js/4.1.0/reset.min.css">
			link rel="stylesheet" href="https://cdnjs.cloudflare.com/ajax/libs/reveal.js/4.1.0/reveal.min.css">
			link rel="stylesheet" href="https://cdnjs.cloudflare.com/ajax/libs/reveal.js/4.1.0/theme/sky.min.css" id="theme">
			link rel="stylesheet" href="https://cdnjs.cloudflare.com/ajax/libs/reveal.js/4.1.0/plugin/highlight/monokai.min.css" id="highlight-theme">
			/section>
I chose to use Reveal.js for this assignment because this was one of my favorite features to learn this semester :)
I know this submission might not be fully what you were looking for, but with graduation on the horizon (following a 21-credit semester) I've decided to take the L! Have a great summer!